I have a significant obsession with lip balms. I always have at least one lip item on my person, and I significantly love shopping for lip care items. I think this behavior is trackable to a childhood affliction of terrible chapped lips:
In any case, I have been wanting to do a cool data vis project for awhile, but was less than inspired by the excellent datasets available on the internet. So I thought about the stuff in my life that comprises the most datapoints, and lip balms were a frivolous but obvious choice.
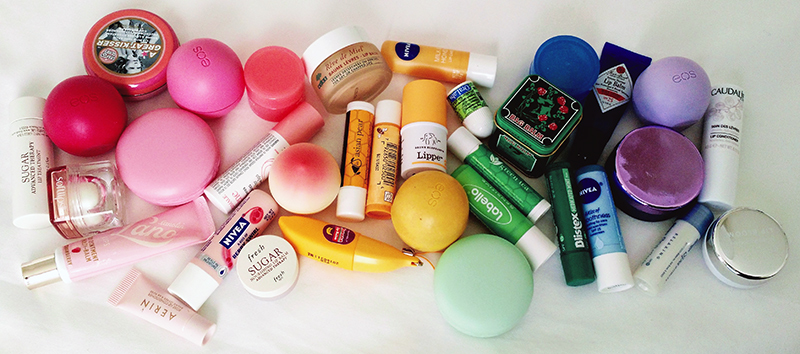
So I set out to find all my lip products. I have limited this experiment to non-colored lip balms and treatments, so no lipstick or anything with color. Even with that limitation, the dataset was rich:
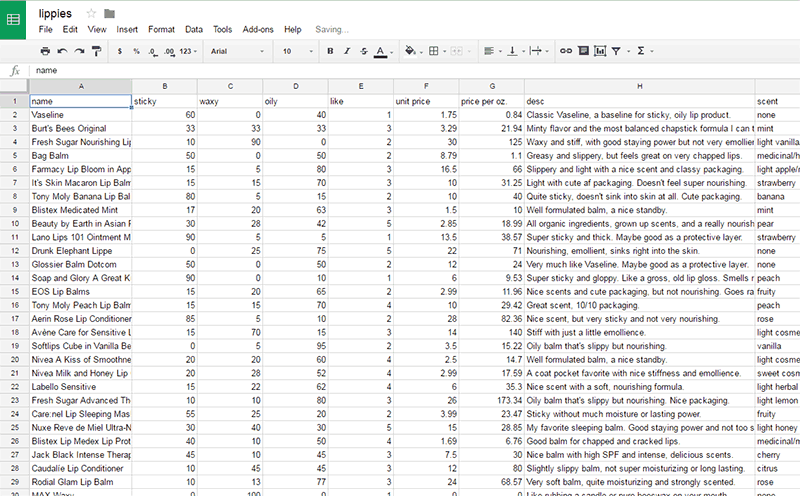
I then worked up a spreadsheet of all this stuff with very not-empirical data. The grading of lip balms along three axes (100% sticky being like having honey or gloopy lip gloss on your mouth, 100% waxy as rubbing your mouth with a candle, and 100% oily as using some olive oil for lip balm) is quite subjective. And the pricing information is subject to change, and I am unlikely to keep it updated.
Next I went looking for some library help to make a nice graph with attractive colors and tooltips and such to make the most of my data. I knew I wanted to work in Python, as it is powerful at data manipulation but I’ve never used it for that. I ended up using Bokeh for my visualization needs.
I calculated the x, y coordinates so that they might make a nice triangle when plotted. Then I plotted the points, added some color and tool tips, and here’s my lip balm data visualisation! Roll over points for more info about each point. I also let the radius size of each plotted circle glyph be based on how much overall I like the item, so large points are things I really love and tiny points are things I don’t like.
I’m super happy with how my little data vis project turned out, and I’m excited to try more! I wish I’d had the Bokeh/Python skillset at this level when my work life was all about data and Excel/CSV files.